Tuesday 7 February 2023

Stochastic Survival of the Densest: defective mitochondria could be seen as altruistic to understand their expansion

With age, our skeletal muscles (e.g. muscle of our legs and arms) work less well. In some people, there is a substantial loss of strength and functionality called sarcopenia. This has a knock-on effect on the health of elderly people. If we want to delay skeletal muscle ageing, so that we can stay active and healthy for longer, we need to understand the mechanism behind it.


The spread of a type of mitochondrial mutants, deletions, has been causally implicated in the ageing of skeletal muscle. But how do these mutations expand, replacing normal (wildtype) mitochondrial DNA? One could think that they have a replicative fitness advantage, therefore they outcompete wildtypes. However, no definitive explanation of this supposed faster replication is known for non-replicating cells, despite numerous proposals. We might even expect that these mutants are actively eliminated since they are disadvantageous to the cell.


In a recent PNAS paper, (free version here) we  unveil a new evolutionary mechanism, termed stochastic survival of the densest, that accounts for the expansion of mitochondrial deletions in skeletal muscle. We do not assume a replicative advantage for deletions, and even allow the possibility of a higher degradation rate for mutants compared to non-mutants. Our stochastic model predicts a noise-driven clonal wave of advance of mitochondrial mutants, recapitulating experimental observation qualitatively  and quantitatively. 


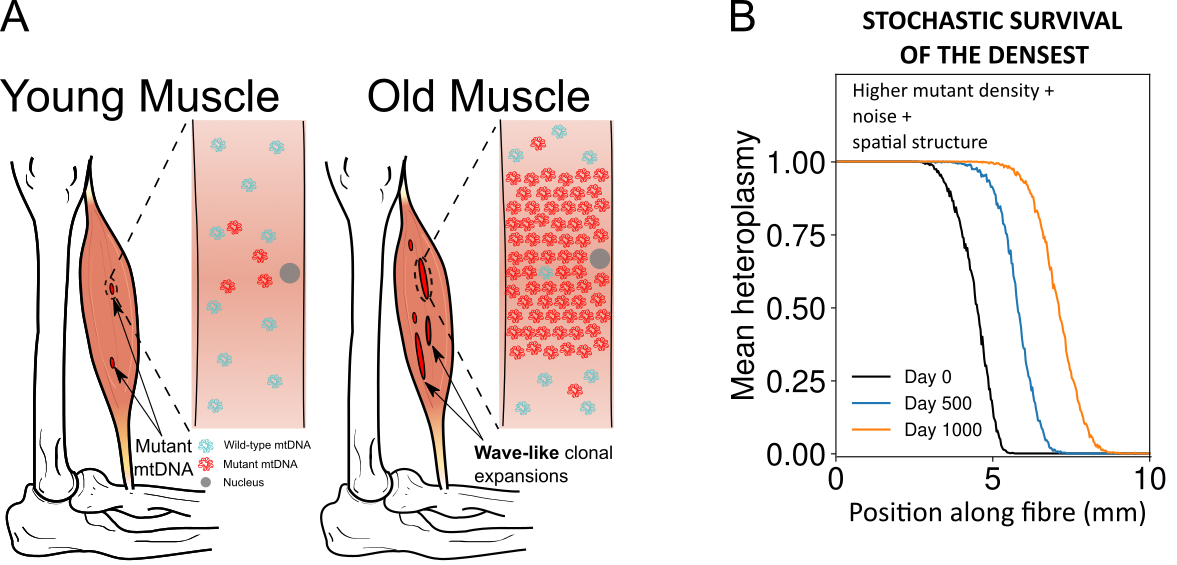
Stochastic survival of the densest accounts for the expansion of mitochondrial DNA mutants in aged skeletal muscle through a noise-driven wave of advance of denser mutants.

A) Dysfunctional mtDNA mutants expand in muscle fibres with age, occupying macroscopic regions where strength and functionality are lost. B) A stochastic model of a spatially extended system predicts a travelling wave of denser mutants (e.g. the mitochondrial deletions in skeletal muscles), according to a novel evolutionary mechanism termed stochastic survival of the densest.


A key reason behind mutants’ expansion is that they can live at higher densities (or carrying capacity) in the muscle fibres. This, together with the stochastic nature of biological processes, gives rise to the surprising wave-like expansion. Remarkably, if you take the noise away, the effect disappears: it is a truly stochastic phenomenon. We are very excited about this new mechanistic understanding: the clonal expansion of deletions has been the subject of intense research for over 30 years. Moreover, this progress allows principled suggestions of therapies that might slow down skeletal muscles ageing. 


We are possibly even more excited about the evolutionary implications of our work. We believe that stochastic survival of the densest is a previously unrecognised mechanism of evolution that can account for other counterintuitive phenomena. We essentially showed that, in the presence of noise, a species can take over a system because the more of it there is the faster all species in the system replicate. This conforms to one of the strict definitions of altruism. Therefore, the model can also account for the spread of altruism: a species can win a competition because it is altruistic. The model we use to show the effect is one of the simplest models for populations (generalised stochastic Lotka-Volterra) and we think that the effect is robust, and will be reproduced by a variety of similar models and in a range of geometries/topologies


Mitochondrial deletion mutants are bad for our muscles and our health, but in order to understand (and counteract) their expansion we might consider them an altruistic species that, driven by noise, outcompetes wildtype mitochondria. Ferdinando and Nick


Community detection in graphons

Graphs are one way to represent data sets as they arise in the social sciences, biology, and many other research domains. In these graphs, the nodes represent entities (e.g., people) and edges represent connections between them (e.g., friendships). For the analysis of graphs, a vast selection of mathematical and computational techniques has been developed. For example, Google uses eigenvectors to quantify the importance of webpages in a graph that represents the word-wide web.

Community detection


One field of interest in the analysis of graphs is the detection of so-called communities. These are groups of nodes that are strongly connected internally but only sparsely to nodes in other groups. A common example in the social sciences are friendship groups. Community-detection methods can be used to cluster large graph-structured data sets and so provide insights into many complex systems. For example, one can use the community structure to investigate how brain function is organised. In these biological graphs, the different communities represent different parts of the brain, each of which fulfilling different functions. Many algorithms to identify communities exist, the most popular of which is modularity maximisation.


Graphons


As the scale of these data sets increase, the graphs that represent them get larger, too. This makes the development of computationally-efficient tools for their analysis a pressing issue. One way to investigate these large, finite objects is to abstract them with idealized infinite objects. In this context, graphons have emerged as one way of looking of infinite-sized graphs. 


One way to motivate graphons is to look at graphs that grow in size (i.e., the number of nodes) by iteratively adding nodes and edges. In Fig. 1, we show graphs of varying size in a so-called pixel image. Each pixel image visualises the edges in a graph with n nodes. The n^2 pixels in each image represent a single pair of nodes and are RED if an edge is connecting the pair of nodes and WHITE if not. With growing network size n, we observe that the pixels get smaller, making the discrete image resemble a continuous density plot. The graphon, as shown on the very right, is the continuous limiting object of such growing graphs as n goes to infinity. This intuitive notion of convergence can be concretised and proven by looking at subgraph counts.


Defining community detection for graphons


In our paper, which was just published in SIAM Applied Mathematics "Modularity maximization for graphons" (free version here) joint with Michael Schaub, we explore how one can define and compute these communities for graphons. To achieve this, we define a modularity function for graphons, which is an infinite-sized limit for the well-established modularity function for graphons. The modularity function for graphs is defined as a function of a double-sum over all pairs of edges. The core idea is, that in the infinite-size limit (i.e, for graphons) this double sum approaches a double integral, which may simplify the computational burden of community detection.


In our paper, we explore a selection of synthetic graphons and compute their community structure. Surprisingly (at least for us), the continuous form of graphons allows us to analytically compute the optimal community structure for some of these --- something that is usually not possible for graphs. Lastly, we outline a computational pipeline that would allow us to detect community structure in a privacy-preserving way (see Fig. 2). Florian and Nick.


Thursday 5 January 2023

Can misinformation really impact people’s intent to get vaccinated?

Health misinformation, especially that related to vaccines, is not a new phenomenon. Growth of the internet in the last two decades has led to an exponential rise in use of online social media platforms. Consequently, many people rely on information available online to inform their health decisions. While social media platforms have improved access to all kinds of information for their users, false information has been shown to diffuse faster and deeper than true information. Therefore, it’s not surprising that the COVID-19 pandemic has been accompanied by an “infodemic”: an excessive spread of false or misleading information, both online and offline, that has eroded trust in scientific evidence and expert advice, and undermined the public health response. Susceptibility to online misinformation regarding the pandemic has been negatively associated with compliance of public health guidance, and willingness to get vaccinated. However, it is not clear if it is exposure to misinformation that lowers vaccination intent, or simply that those who are unwilling to vaccinate believe in (mis)information that justifies their stance on vaccination.

This begs the question, can exposure to misinformation actually lower people’s intent to get vaccinated? Given the hidden underlying factors that can induce a correlation between belief in misinformation and unwillingness to vaccinate, we conducted a randomized controlled experiment in September 2020 in the UK and the USA on a representative sample of 4,000 people from each country. Everyone was asked about their intention to get a COVID-19 vaccine to protect themselves. Two-thirds of the people were then exposed to five recently circulating pieces of online misinformation about COVID-19 vaccines, whereas one-third were exposed to five pieces of factually correct information to serve as a control group. Following this, people were asked again about their vaccination intent. This allowed us to quantify the causal impact of exposure to misinformation, relative to factual information, on vaccination intent. Before exposure, 54.1% of respondents in the UK and 42.5% in the USA reported that they would “definitely” accept a COVID-19 vaccine, while 6.0% and 15.0% said they would “definitely not” accept it. Unfortunately, even this brief exposure to misinformation induced a decline in intent of 6.2 percentage points in the UK and 6.4 percentage points in the USA among those who stated that they would definitely accept a vaccine. Interpreting these results in the context of vaccination coverage rates required to achieve herd immunity—which ranges from anywhere between 55% to 85% depending on the country and infection rate—suggests that misinformation could impede efforts to successfully fight the pandemic.

Randomized controlled experiment reveals that exposure to misinformation can reduce the willingness to vaccinate oneself against COVID-19, which may be detrimental to goals of achieving herd immunity.


Since now we know that COVID-19 misinformation can indeed reduce people’s willingness to vaccinate, what can be done about it? We must understand the how and why of it. There exist a small minority of organized actors who supply much of this misinformation online, but the vast majority of people do not actively seek to spread misinformation. They are simply trying to make an informed decision while faced with a deluge of information, and false narratives that exploit people’s fear and anxieties simply become more likely to be shared ahead. In our research (in Nature Human Behaviour), we found that scientific-sounding misinformation that purported a direct link between the COVID-19 vaccine and adverse effects were associated more strongly with a decline in intent. This extends the scope of the problem beyond online misinformation, and towards understanding and addressing vaccine hesitancy more broadly. Individually, we must understand the concerns of our peers, and think about veracity over emotions before sharing anything with them, online or offline. Collectively, we must foster a deeper public understanding of vaccination, which can be brought about by clearer scientific communication, and rebuilding trust in institutions. Sahil

Wednesday 4 January 2023

Inference and influence of network structure using snapshot social behavior without network data

In a more and more polarized world, the role of underling social structure driving social influence in opinions and behaviours is still unexplored. In this study we developed a method, the kernel-Blau-Ising model (KBI), to uncover how people are influenced/connected based on their socio-demographic coordinates (e.g., income, age, education, postcode), and tested the model in the EU referendum and two London Mayoral elections.

Outline of the KBI methodology (high res image here). Input data consist of aggregated behavioral data for different geographical areas and sociodemographic variables (age, income, education, etc.) associated to those areas (from census data). (A) Heatmap of (hypothetical) behavioral data in Greater London, in this case electoral outcomes, where red represents 100% votes to Labour and blue represents 100% votes to Conservatives. (B) Probability distribution of behavioral outcomes in (A). (C) Blau space representation of the behavioral outcomes spanned by sociodemographic characteristics (e.g., age and income). (D) Blau space representation of KBI approach using input data in and learning parameters: the External Fields, which account for the general trends, e.g., older people are more likely to vote Conservatives than younger people, and the network that connects the population according to their distances in the Blau space and their homophilic preferences. Once the model parameters are learnt, we can further estimate how changes and interventions affect behavioral outcomes. Examples of potential network-sensitive intervention strategies: how changes to income distribution (E) and homophilic preferences (F) can reduce behavioral polarization.


Despite using no social network data, we discover established signatures of homophily, the tendency to befriend those similar to oneself—the stronger homophily is, the more social segregation. We found consistent geographical segregation for the three elections, while education was a strong segregation factor for the EU Referendum, it wasn’t for Mayoral Elections, however, age and income were. The model can be used to explore how reducing inequalities or encouraging mixing among groups can reduce social polarization. You can read about our work "Inference of a universal social scale and segregation measures using social connectivity kernels" free in the journal Science Advances here. Antonia and Nick


Thursday 29 October 2020

catch22 features of signals

 By taking repeated measurements over time we can study the dynamics of our environment – be it the mean temperature of the UK by month, the daily opening prices of stock markets, or the heart rate of a patient in intensive care. The resulting data consists of an ordered list of single measurements and we will call it ‘time series’ from now on. Time series can be long (many measurements) and complex and in order to facilitate exploitation of the gathered data we often want to summarise the captured sequences. For example, we might collapse the 12 monthly mean temperatures for each of the past 100 years to a yearly average. This would enable us to remove the effects of the seasons, reduce 12 yearly measurements to 1 and thereby let us quickly compare the temperatures across many years without studying each monthly measurement. Taking the average value of a time-series is a very simple example of a so called ‘time series feature’, an operation that takes an ordered series of measurements as an input and gives back a single figure that quantifies one particular property of the data. By constructing a set of appropriate features, we can compare, distinguish and group many time series quickly and even understand in what aspects (i.e., features) two time series are similar or different.


Over the past decades, thousands of such time-series features have been developed across different scientific and industrial disciplines, many of which are much more sophisticated than an average over measurements. But which features should we choose from this wealth of options for a given data set of time series? Do features exist that can characterise and meaningfully distinguish sequences from a wide range of sources?


We here propose a selection procedure that tailors feature-sets to given collections of time-series datasets and that can identify features which are generally useful for many different sequence types. The selection is based on the rich collection of 7500+ diverse candidate features previously gathered in the comprehensive ‘highly comparative time-series analysis’ (hctsa) toolbox (paper here) from which we automatically curate a small, minimally redundant feature subset based on single-feature performances on the given collection of time-series classification tasks.

Figure 1: The selected 22 features perform only slightly worse than the full (pre-filtered) set of 4,791. A Scatter of classification accuracy in each dataset, error bars signify standard deviation across folds. B Mean execution times for time series of length 10,000. C Near-linear scaling of computation time with time-series length.


By applying our pipeline to a standard library of 93 classification problems in the data-mining literature (UEA/UCR), we compiled a set of 22 features (catch22) that we then implemented in C and wrapped for R, Python, and Matlab. The 22 resulting features individually possess discriminative power and only do ~10% worse than the full hctsa feature set on the considered data at a highly (1000-fold) reduced computation time, see Fig. 1.


As the UEA/UCR-datasets mainly consists of short, aligned, and normalised time series, the features are especially suited to these characteristics. The selection pipeline may be applied to other collections of time-series datasets with different properties to generate new, different feature sets and can further be adapted to performance metrics other than classification accuracy to select features for analyses such as clustering, regression, etc.


See full paper for all the details here for free (http://link.springer.com/article/10.1007/s10618-019-00647-x) under the title "catch22: CAnonical Time-series CHaracteristics Selected through highly comparative time-series analysis" in the journal Data Mining and Knowledge Discovery. The catch22 feature set is on GitHub (https://github.com/chlubba/catch22). Carl, Ben, Nick


Universal approaches to measuring social distances and segregation

How people form connections is a fundamental question in the social sciences. Peter Blau offered a powerful explanation: people connect based on their positions in a social space. Yet a principled measure of social distance remains elusive. Based on a social network model, we develop a family of intuitive segregation measures formalising the notion of distance in social space.

The Blau space metric we learn from connections between individuals offers an intuitive explanation for how people form friendships: the larger the distance, the less likely they are to share a bond. It can also be employed to visualise the relative positions of individuals in the social space: a map of society.

Using US and UK survey data, we show that the social fabric is relatively stable across time. Physical separation and age have the largest effect on social distance with implications for intergenerational mixing and isolation in later stages of life. You can read about our work "Inference of a universal social scale and segregation measures using social connectivity kernels" free here and in the journal Royal Society Interface here. Till and Nick.

Stochastic Survival of the Densest: defective mitochondria could be seen as altruistic to understand their expansion

With age, our skeletal muscles (e.g. muscle of our legs and arms) work less well. In some people, there is a substantial loss of strength an...