Thursday, 11 December 2014

Turbocharging the back of the envelope

The numbers that we use to describe the world are rarely exact. How long will it take you to drive to work? Perhaps "between 20 and 30 minutes". It would be unwise (and unnecessary) to say "exactly 23.4 minutes".

This uncertainty means that "back-of-the-envelope" calculations are very valuable in estimating and reasoning about numerical problems, particularly in the sciences. The idea here is to perform a calculation using rough guesses of the quantities involved, to get an "order of magnitude" estimate of the answer you're after. Made famous in physics as "Fermi problems", attributed to Enrico Fermi (who used rough reasoning to deduce quantities from the power of an atomic bomb to the number of piano tuners in Chicago), this approach is integral in many current applications of maths and science. Cool books like "Street-fighting Mathematics", "Guesstimation", "Back of the envelope physics", the excellent "What If?" section of xkcd, and the lateral interview questions facing some job candidates: "how much of the world's water is contained in a cow?" are all examples.

Calculations in biology, such as the time it takes for a protein (foreground) to diffuse through an E. coli cell (background), are often subject to large uncertainties. Our approach and web tool allows us to track this uncertainty and obtain a probability distribution over possible answers (plotted).
We've built a free online calculator (Caladis -- calculate a distribution) that complements this approach by allowing one to take the uncertainty in one's estimates into account throughout a calculation. For example, what volume of CO2 is produced by our yearly driving? We could say that we cover 8000 miles per year "give or take" 1000 miles, and find that our car's CO2 emissions are between 100 and 150 grams per kilometre. Our calculator allows us to do the necessary conversions and sums while taking this possible variability into account -- doing maths with "probability distributions" describing our uncertainty. We no longer obtain a single (possibly inaccurate) answer, but a distribution telling us how likely any particular answer is -- in this case a rather concerning bell-shaped distribution between 1 and 2 tonnes which can be viewed here

In the sciences, particularly in biology, measurements often have substantial uncertainties -- due to experimental error, natural variability in the system of interest, or both -- and so using distributions rather than single numbers in calculations allows us to understand and process more about the question of interest. "Back-of-the-envelope" calculations are certainly useful in biology but, owing to the uncertainties involved, one can trust one's estimates better if one has a smart envelope that takes that uncertainty into account.  We've written an accompanying paper "Explicit tracking of uncertainty increases the power of quantitative rule-of-thumb reasoning in cell biology" (free to all in Biophysical Journal) showing how to use our calculator -- in conjunction with the excellent Bionumbers online database, a collection of (often uncertain) experimental measurements in biology -- to make real biological calculations more powerful. Do have a go at using our calculator at www.caladis.org : it's user-friendly and there are lots of examples showing how it works! Iain and Nick

Thursday, 4 December 2014

Therapies for mtDNA disease: models and implications

Mitochondrial DNA (mtDNA) is a molecule in our cells that contains information about how to build important cellular machines that provide us with the energy required for life. Mutations in mtDNA can prevent our cells from producing these machines correctly, causing serious diseases. Mutant mtDNA can be passed from a carrier mother to her children, and as the amount of mutated mtDNA inherited can vary, children's symptoms can be much more severe (often deadly) than those in the mother.

Several therapies exist to prevent or minimise the inheritance of mutant mtDNA from mother to daughter. These range from simply using a donor mother's eggs (in which case the child inherits no genes from the "mother") to amazing new techniques where a mother's nucleus is transferred into a donor's egg cell which has had its nucleus removed (so that the child inherits nuclear DNA from the mother and father, and healthy mtDNA from the donor). The UK is currently debating whether to allow these new therapies: several potential scientific issues have been identified in their application.

If a mother carries an mtDNA mutation, (A) no clinical intervention can lead to her child inheriting that mutation and developing an mtDNA disease. Several "classical" (B-C) and modern (D-E) strategies exist to attempt to prevent the inheritance of mutant mtDNA, which we review (see paper link below)


As experiments with human embryos are heavily restricted, experiments in animals provide the bulk of our knowledge about how these therapies may work. We have previously written about our research in mice, highlighting a possible issue arising from mtDNA "segregation", where one type of mtDNA (possibly carrying a harmful mutation) may proliferate over another: this phenomenon could, in some circumstances, nullify the beneficial effects of mtDNA therapies. Another possible issue involves the effects of "mismatching" between the mother and father's nuclear DNA and the donor's mtDNA: current experimental evidence is conflicted regarding the strength of this effect. Finally, mismatch between donor mtDNA and any leftover mother mtDNA may also lead to biological complications.

We have recently written a paper explaining and reviewing the current state of knowledge of these effects, summarising the evidence from existing animal experiments. We are positive about implementing these therapies, which have the potential to prevent the inheritance of devastating diseases. However, we note cautions about this implementation, noting that several scientific questions remain debated or unanswered. We particularly highlight that "haplotype matching", a strategy to ensure that donor and mother mtDNA are as similar as possible, will largely remove these concerns. Iain

Wednesday, 12 November 2014

Mitochondrial motion in plants


Mitochondria are often likened to the power stations of the cell, producing energy that fuels life's processes. However, compared to traditional power stations, they're very dynamic: mitochondria move through the cell, and fuse together and break apart (among other things). Interestingly, their ability to move and undergo fusion and fission affects their functionality, and so has powerful implications for understanding disease and cellular energy supplies.


Because of this central role, it is important to understand the fundamental biological mechanisms that govern mitochondrial dynamics. Several important genes controlling mitochondrial dynamics are known in humans (and other organisms), but plant mitochondria (despite the fundamental importance of plant bioenergetics for our society) are less well understood.
Our collaborators, David Logan and his team, working with a plant called Arabidopsis, observed that a particular gene, entertainingly called "FRIENDLY", affected mitochondrial dynamics when it was artificially perturbed. (This approach, artificially interfering with a gene to explore the effects that it has on the cell and the overall organism, is a common one in cell biology.) We've just written a paper with them "FRIENDLY regulates mitochondrial distribution, fusion, and quality control in Arabidopsis" (free here) exploring these effects. Plants with disrupted FRIENDLY had unusual clusters of mitochondria in their cells, their mitochondria were stressed, and cell death and poor plant growth resulted.

Simulation of mitochondrial dynamics

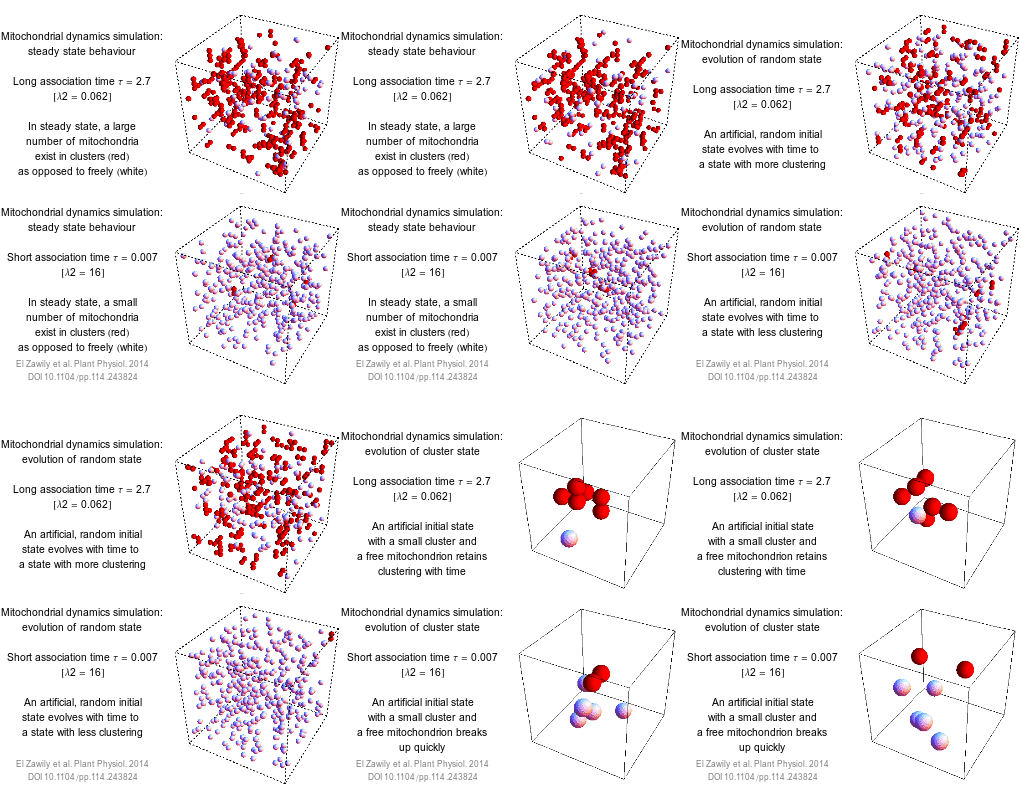
We used a 3D computational and mathematical model of randomly-moving mitochondria within the cell to show that an increased "association time" (the friendly mitochondria stick around each other for longer) was sufficient to explain the experimental observations of clustered mitochondria. Our paper thus identifies an important genetic player in determining mitochondrial dynamics in plants; and explores in substantial detail the intra-cellular, bioenergetic, and physiological implications of perturbation to this important gene. Iain and Nick


Thursday, 23 October 2014

'Mitoflashes' indicate acidity changes rather than free radical bursts


As we've written about before, mitochondria generate the energy required by our cells through respiration that involves using an "electrochemical gradient" as an energy store (a bit like pumping water up into a reservoir for energy storage to then harness it flowing down the gradient of a hill to turn a turbine), and produces superoxide (free oxygen radicals) as a by-product (a bit like sparks when the pumps are running hot). The fundamental importance of this machinery which not only delivers energy, but is also involved in disease and aging  has led to its investigation in great molecular detail (comparable to taking the turbines and generators apart to learn about their function). Much less is known about how mitochondria actually behave when they are fully functional in their natural environment inside our cells (comparable to looking at the fully intact and running turbine), and progress has been difficult since suitable `tools' are scarce.

A debate exists in the scientific literature about one of the key "tools" used in the investigation of living cells. A particular fluorescent sensor protein called cpYFP (circularly permuted yellow fluorescent protein) is used in biological experiments, ostensibly as a way of measuring the levels of superoxide/free oxygen radicals  in a mitochondrion. Our colleagues, however, have cast doubt on the ability of cpYFP to measure superoxide, providing evidence that it instead responds to pH, part of the above electrochemical gradient. This debate was complicated by the fact that in biology, pH and superoxide can vary together, as the amount of "driving" and amount of "sparks" might be expected to.

As another analogy: If we found an unknown measuring device and we did not know how it works, but we saw that it responds during sunny weather, we may conclude that it measures warm temperature. However, it may in fact measure high atmospheric pressure which is, like warm temperatures, often correlated with good weather.  
The protein cpYFP changes its fluorescence in response to pH changes, but is unaffected by superoxide changes.

A recent and fascinating paper in Nature observed that "flashes" of the cpYFP sensor during early development of worms (as a model for other animals and humans) were correlated with their eventual lifespan. However, despite the debate about what it is exactly that the  cpYFP sensor measures, the paper interpreted it as responding to superoxide: looking at the correlation in the light of the so called “free radical theory of aging". This long-standing and much debated theory hypothesizes that the cause of why we age and eventually die is related to the constant production of free oxygen radicals in our mitochondria causing a steady increase in damage to our cells weakening their energetic machinery more and more and making them prone to illnesses.

In response to this, our colleagues decided to settle the question about what the sensor actually measures chemically, removing biological complications from the system. In the analogy of the unknown measurement device, the device was now tested under controlled temperature and controlled pressure to clearly distinguish between the two. They produced an experimental setup where a mix of chemicals was used to generate superoxide in the absence of any pH change. cpYFP in this mix did not show any signal, showing that it remains unresponsive to superoxide. In concert, they showed that even small changes in pH produced a dramatic response in cpYFP signal. Finally, they investigated the physical structure of cpYFP, showing that a large opening in the barrel-like structure of the protein exposes a pH-sensitive chemical group to its environment (comparable to showing how exactly the inner mechanics of the unknown measurement device can pick up pressure changes). We thus concluded, in a recent publication "The ‘mitoflash’ probe cpYFP does not respond to superoxide" (in the journal Nature here) that the cpYFP sensor reports pH rather than superoxide, and that results using cpYFP (including the above Nature paper, which remains fascinating) should be interpreted as such. Iain, Markus and Nick

Friday, 6 June 2014

Evolutionary competition within our cells: the maths of mitochondrial DNA

Women may carry mutated copies of mitochondrial DNA (mtDNA) -- a molecule that describes how to build important cellular machinery relating to cellular energy supply. If this mutant mtDNA is passed on to that woman's child, the child may develop a mitochondrial disease, which are often degenerative, fatal, and incurable.

Joerg created mice that contained two types of mtDNA -- here illustrated as blue (lab mouse mtDNA) and yellow (mtDNA from a mouse from a wild population). We used several different wild mice from across Europe to represent the mtDNA diversity one may find in a human population. We found that throughout a mouse's lifetime, one mtDNA type often outcompetes another (here, yellow beats blue), with different patterns across different tissues.
Amazing new therapies potentially allow a carrier mother A and a father B to use another woman C's egg cells to conceive a baby without much of mother A's mtDNA being present. The approach involves taking nuclear DNA content from A and B (so that most of the child's features are inherited from the true mother and father), and placing it into C's egg cells, which contain a background of healthy mtDNA. You can read about, what are misleadingly called, three-parent babies here.


Something that is less discussed is that, in this process, a small amount of A's mutant mtDNA can be "carried over" into C's cell. If this small amount remains small through the child's life, there is no danger of disease, as the larger amount of healthy C mtDNA will allow the child's cell to function normally. We can think of the resulting situation as a competition between A and C -- if A and C are evenly matched, the small amount of A will remain small; if C beats A, the small amount of A will disappear with time; and if A beats C, the small amount of A will increase and may eventually come to dominate over C.

Until recently it has been fair to assume that A and C are always about evenly matched (unless something is drastically different between A or C). However, evidence for this idea was based on model organisms in laboratories, which do not have the same amount of genetic diversity as found in human populations. Our collaborator Joerg addressed this by capturing wild mice from across central Europe, selecting a set that showed a comparable degree of genetic diversity to that expected in a human population. He used these, with our modelling and mathematical analysis, to show that pronounced differences between A and C often exist, and are more likely in more diverse populations. The possibility that A beats C, and mutant mtDNA comes to dominate the child's cells, therefore cannot be immediately discounted in a diverse population. We propose "haplotype matching" -- ensuring that A and C are as similar as possible -- to ameliorate this potential risk. It's open as to whether one can generalize from observations in mice to people and it's also open as to whether our conclusions, which used lab-mice as parent A (which are not entirely typical creatures) of necessity generalize to other non-lab mouse types. 

Our mathematical approach also allowed us to explore, in detail, the dynamics by which this competition within cells occurs. We were able to use our data rather effectively by having a statistical model that allowed us to reason jointly about a range of data sets. We found that the degree to which one population of mtDNA beat the other depended on how genetically different they were.  We found that different tissues were like different environments: some favouring C over A and some vice-versa. This is perhaps surprising to some as this evolution in the proportions of different genetic species is not something we imagine occurring inside us, during our lives, and as something that might differ between our organs. We found several different regimes, where the strength of competition changes with time and as the organism develops: when our cells are multiplying faster they show a more marked preference for one of the species. We've shown our results to the UK HFEA in its ongoing assessment of these therapies, and you can read, for free, about our work called ``mtDNA Segregation in Heteroplasmic Tissues Is Common In Vivo and Modulated by Haplotype Differences and Developmental Stage'' in the journal Cell Reports here. Iain, Joerg, Nick.


large Image
We found that one mtDNA type beat another in different ways across many different tissue type. Here, the height (or depth) of a column represents how much the mtDNA from a wild mouse wins (or loses) against that from a lab mouse in different tissues. The bottom row corresponds to the smallest difference between wild and lab mtDNA; the top row corresponds to the greatest difference.

Thursday, 10 April 2014

What's the difference? Telling apart two sets of signals

We are constantly observing ordered patterns all around us, from the shapes of different types of objects (think of different leaf shapes, yoga poses), to the structured patterns of sound waves entering our ears and the fluctuations of wind on our faces. Understanding the structure in observations like these have much practical utility: For example, how do we make sense of the ordered patterns of heart beat intervals for medical diagnosis, or the measurements of some industrial process for quality checking? We have recently published an article that automatically learns the discriminating structure in labeled datasets of ordered measurements (or time series or signals)---that is, what is it about production-line sensor measurements that predict a faulty process, or what is it about the shape of Eucalyptus leaves that distinguish them from other types of leaves?

Conventional methods for comparing time series (within the area of time-series data mining) involve comparing their measurements through time, often using sophisticated methods (with science fiction names like "dynamic time warping") that squeeze together pairs of time series patterns to find the best match. This approach can be extremely powerful, allowing new time series to be classified (e.g., in the case of a heart beat measurement, labelling it as a "healthy" heart beat or a "congestive heart failure"; or in the case of leaf shapes, labelling it as "Eucalyptus", "Oak", etc.), by matching them to a database of known time series and their classifications. While this approach can be good at telling you whether your leaf is a "Eucalyptus", it does not provide much insight into what it is about Eucalyptus leaves that is so distinctive. It also requires one to compare a new leaf to all other leaves in your database, which can be an intensive process. 


A) Comparing time series by alignment B) Comparing time series by their structural features: in this we probe many structural features of the time series simultaneously (ii) and then distil out the relevant ones (iii).
Our method learns the properties of a given class of time series (e.g., the distinguishing characteristics of Eucalyptus leaves) and classifies new time series according to these learned properties. It does so by comparing thousands of different time-series properties simultaneously, that we developed in previous work that we blogged about here. Although there is a one-time cost to learn the distinguishing properties, this investment provides interpretable insights into the properties of a given dataset (this kind of task is very useful for scientists when they want to understand the difference between their control data and the data from their experimental interventions) and can allow new time series to be classified rapidly. The result is a general framework for understanding the differences in structure between sets of time series. It can be used to understand differences between various types of leaves, heart beat intervals, industrial sensors, yoga poses, rainfall patterns, etc. and is a contribution to helping the data science/ big-data/ time-series data mining literature deal with...bigger data.
Each of the dots corresponds to a time series. The colours correspond to (computer generated) time series of six different types. We identify features that allow us to do a good job of distinguishing these six types.

Our work will be appearing with the name "Highly comparative, feature based, time-series classification" in the acronymically titled IEEE TKDE and you can find a free version of it here. Ben and Nick.

Wednesday, 9 April 2014

Polyominoes: mapping genotypes to phenotypes


Biological evolution sculpts the natural world and relies on the conversion of genetic information (stored as sequences, usually of DNA, called genotypes) into functional physical forms (called phenotypes). The complicated nature of this conversion, which is called a genotype-phenotype (or GP) map, makes the theoretical study of evolution very difficult. It is hard to say how a population of individuals may evolve without understanding the underlying GP map.

This is due to the two fundamental forces of evolution -- mutations and natural selection -- acting on different aspects of an organism. Mutations occur to genotypes (G), while natural selection, the ultimate adjudicator of the fate of mutations in the population, acts on the phenotype (P). Without understanding the link between these two -- the GP map -- we can't easily say, for example, how many mutations we expect important proteins within a virus strain to undergo with time, and thus how quickly the virus will evolve to be unrecognised by our immune systems.

Simple models for the mapping of genotype to phenotype have helped answer important questions for some model biological systems, such as RNA molecules and a coarse-grained model of protein folding. One important class of biological structure which has not yet been modelled in this way are protein complexes: structures formed through proteins binding together, fulfilling vital biological functions in living organisms. In this work, we introduce the "polyomino" model, based on the self-assembly of interacting square tiles to form polyomino structures. The square tiles that make up a polyomino are assigned different "sticky patches", modelling the interactions between different proteins that form a complex. A huge range of structures can be formed by varying the details of these patches, mimicking the range of protein complexes that exist in biology (though there are some obvious differences in the shapes of structures that can be formed).
Our simple model explores the interactions between protein subunits, and how these interactions shape a surface that evolution explores. (top) Sickle-cell anemia involves a mutation that changes the way proteins interact, making normally independent units form a dangerous extended structure. (bottom) Our polyomino model models this effect. The resultant dramatic effects on structure, fitness, and evolution can then be explored.
Despite its abstraction we show that the polyomino model displays several important features which make it a potentially useful model for the GP map underlying protein complex evolution. On top of this, we demonstrate that our model possesses similar properties to RNA and protein folding models, interestingly suggesting that universal features may be present in biological GP maps and that the "landscapes" upon which evolution searches may thus have general properties in common. You can find the paper free here and you can read about polominoes here and play a game here. Iain

Tuesday, 1 April 2014

Fast inference about noisy biology

Biology is a random and noisy world -- as we've written about several times before! (e.g. here and here) This often means that when we try to measure something in biology -- for example, the number of a particular type of proteins in a cell, or the size of a cell -- we'll get rather different results in each cell we look at, because random differences between cells mean that the exact numbers are different in each case. How can we find a "true" picture? This is rather like working out if a coin is biased by looking at lots of coin-flip results.

Measuring these random differences between cells can actually tell us more about the underlying mechanisms for things like (to use the examples above) the cellular population of proteins, or cellular growth. However, it's not always straightforward to see how to use these measurements to fill out the details in models of these mechanisms. A model of a biological process (or any other process in the world) may have several "parameters" -- important numbers which determine how the model behaves (the bias of a coin, is an example, telling us what proportion of times we'll see heads). These parameters may include, for example, rates with which proteins are produced and degraded. The task of using measurements to determine the values of these parameters in a model is generally called "parametric inference". In a new paper, I describe a new and efficient way of performing this parametric inference given measurements of the mean and variance of biological quantities. This allows us to find a suitable model for a system describing both the average behaviour and typical departures from this average: the amount of randomness in the system. The algorithm I propose is an example of approximate Bayesian computation (ABC) which allows us to deal with rather "messy" data: I also describe a fast (analytic) approach that can be used when the data is less messy (Normally distributed).


Parametric inference often consists of picking a trial set of parameters for a model and seeing if the model with those parameters does a good job of matching experimental data. If so, those parameters are recorded as a "good" set, otherwise, they're discarded as a "bad" set. The increase in efficiency in my proposed approach is due to the fact that we can perform a quick, preliminary check to see if a particular parameterisation is "bad", before spending more computer time on rigorously showing that it is "good". I show a couple of examples in which this preliminary checking (based on fast computation of mean results before using stochastic simulation to compute variances) speeds up the process by 20-50% on model biological problems -- hopefully allowing some scientists to grab a little more coffee time! This work will be coming out in the journal Statistical Applications in Genetics and Molecular Biology with the title `Efficient parametric inference for stochastic biological systems with measured variability' and you'll find the article (free) here. Iain

Stochastic Survival of the Densest: defective mitochondria could be seen as altruistic to understand their expansion

With age, our skeletal muscles (e.g. muscle of our legs and arms) work less well. In some people, there is a substantial loss of strength an...