Showing posts with label data science. Show all posts

Thursday, 10 April 2014

What's the difference? Telling apart two sets of signals

We are constantly observing ordered patterns all around us, from the shapes of different types of objects (think of different leaf shapes, yoga poses), to the structured patterns of sound waves entering our ears and the fluctuations of wind on our faces. Understanding the structure in observations like these have much practical utility: For example, how do we make sense of the ordered patterns of heart beat intervals for medical diagnosis, or the measurements of some industrial process for quality checking? We have recently published an article that automatically learns the discriminating structure in labeled datasets of ordered measurements (or time series or signals)---that is, what is it about production-line sensor measurements that predict a faulty process, or what is it about the shape of Eucalyptus leaves that distinguish them from other types of leaves?

Conventional methods for comparing time series (within the area of time-series data mining) involve comparing their measurements through time, often using sophisticated methods (with science fiction names like "dynamic time warping") that squeeze together pairs of time series patterns to find the best match. This approach can be extremely powerful, allowing new time series to be classified (e.g., in the case of a heart beat measurement, labelling it as a "healthy" heart beat or a "congestive heart failure"; or in the case of leaf shapes, labelling it as "Eucalyptus", "Oak", etc.), by matching them to a database of known time series and their classifications. While this approach can be good at telling you whether your leaf is a "Eucalyptus", it does not provide much insight into what it is about Eucalyptus leaves that is so distinctive. It also requires one to compare a new leaf to all other leaves in your database, which can be an intensive process. 


A) Comparing time series by alignment B) Comparing time series by their structural features: in this we probe many structural features of the time series simultaneously (ii) and then distil out the relevant ones (iii).
Our method learns the properties of a given class of time series (e.g., the distinguishing characteristics of Eucalyptus leaves) and classifies new time series according to these learned properties. It does so by comparing thousands of different time-series properties simultaneously, that we developed in previous work that we blogged about here. Although there is a one-time cost to learn the distinguishing properties, this investment provides interpretable insights into the properties of a given dataset (this kind of task is very useful for scientists when they want to understand the difference between their control data and the data from their experimental interventions) and can allow new time series to be classified rapidly. The result is a general framework for understanding the differences in structure between sets of time series. It can be used to understand differences between various types of leaves, heart beat intervals, industrial sensors, yoga poses, rainfall patterns, etc. and is a contribution to helping the data science/ big-data/ time-series data mining literature deal with...bigger data.
Each of the dots corresponds to a time series. The colours correspond to (computer generated) time series of six different types. We identify features that allow us to do a good job of distinguishing these six types.

Our work will be appearing with the name "Highly comparative, feature based, time-series classification" in the acronymically titled IEEE TKDE and you can find a free version of it here. Ben and Nick.

Wednesday, 3 April 2013

A compound methodological eye on nature’s signals


A compound methodological eye on nature’s signals: Background signals are both empirical (e.g. ECGs and human speech) and simulated (e.g. correlated noise and maps); the arctic krill eye shows output from thousands of time-series analysis methods wrapped around it [Fig.1 of our paper showing the results of applying 8651 methods to a set of time series]. Image created by B. D. Fulcher Accreditation details for the krill eye can be found here.
"… as an uneven mirror distorts the rays of objects according to its own figure and section, to the mind, when it receives impression of objects through the sense, cannot be trusted to report them truly, but in forming its notions mixes up its own nature with the nature of things…" Francis Bacon

We are constantly interacting with signals in the world around us: noticing the fluctuating breeze against our faces, observing the intermittent flickering of a candle, or becoming absorbed in the regularity of one’s own pulse. Researchers across science have developed highly sophisticated methods for understanding the structure in these types of time-varying processes, and identifying the types of mechanisms that produce them. However, scientists collaborate between disciplines surprisingly rarely, and therefore tend to use a small number of familiar methods from their own discipline. But how do the standard methods used in economics relate to those used in biomedicine or statistical physics?

In a recent article "Highly comparative time-series analysis: the empirical structure of time series and their methods" that appeared, accessible free, in Journal of the Royal Society Interface, we investigated what can be learned by comparing such methods from across science simultaneously. We collected over 9000 scientific methods for analysing signals, and compared their behaviour on a collection of over 35 000 diverse real-world and model-generated time series. The result provides a more unified and highly comparative scientific perspective on how scientists measure and understand structure in their data. For example, we showed how methods from across science that display similar behaviour to a given target can be retrieved automatically, or how different real-world or model-generated data with similar properties to a target time series can be retrieved similarly. Further examples of the kinds of questions we ask are in the boxes in the figure below. The result provides an interdisciplinary scientific context for both data and their methods. We also introduced a range of techniques for exploiting our library of methods to treat specific challenges in classification and medical diagnosis. For example, we showed how useful methods for diagnosing pathological heart beat series or Parkinsonian speech segments can be selected automatically, often yielding unexpected methods developed in disparate disciplines or in the distant past.

Representing a time series by the results of the behaviour of a set of automatically selected statistical methods and, unusually, representing statistical methods by their behaviour on a set of time series provides a form of empirical fingerprint for our time series and our methods. Given this fingerprint we can automatically answer questions like those posed in the boxes above. This gives us a powerful complement to the more conventional process of studying our methods and our data. [Based on Fig 2 of our paper]

We are developing a web platform to help this kind of comparative interdisciplinary scientific analysis, which can be found at http://www.comp-engine.org/timeseries/ The plan is to use this to allow people to exchange data, code for methods and to put each object in its context. Ben, Max and Nick

Tuesday, 5 February 2013

Evolutionary inference for functions

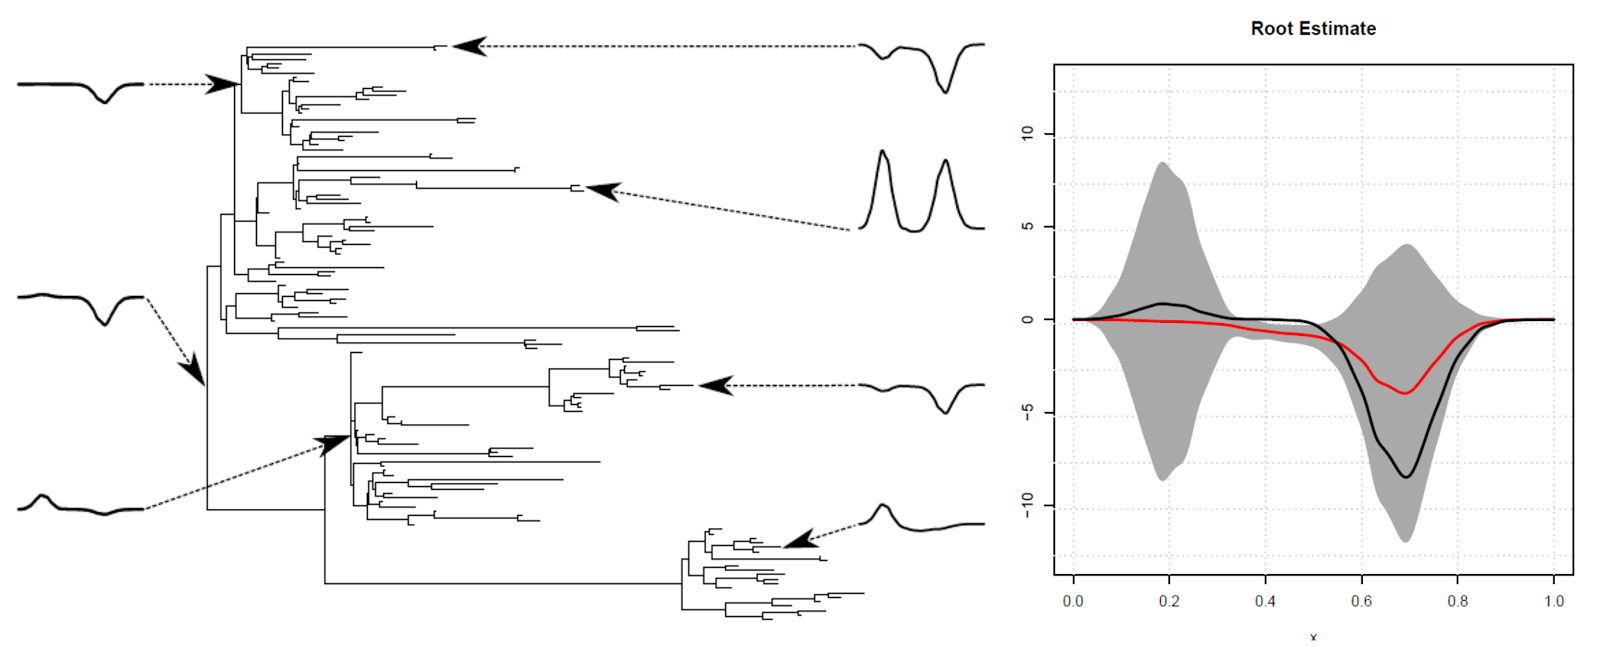
How might we reason about the forms of our unseen ancestors? I discuss a possible application to speech sounds in an earlier blog article (necrophonetics). A paper with John Moriarty which provides relevant theory came out lately in Royal Society Interface as "Evolutionary inference for function-valued traits: Gaussian process regression on phylogenies" (free version from this page). The gist of the idea is that some things in nature, like sounds or patterns, evolve in time and are best described as mathematical functions. Gaussian processes are a class of process which are very suited to the evolution of functions. An example of an evolving function would be a drawing of a line which is copied repeatedly (see here for a movie of us making school students do this). Having done the theory, Pantelis Hadjipantelis from Warwick (a student of John Aston) and  Chris Knight and David Springate helped take this further. They investigated whether our theory could be made to work in practice and considered careful simulated examples. In these we could see how our best estimate about characteristics of the evolutionary process and the form of the ancestors compared against (simulated) reality. We did reasonably well. On the way we used Independent Components Analysis - a very handy method. This work will be appearing shortly in Royal Society Interface as "Function-Valued Traits in Evolution" free version here. Having convinced ourselves of the relevance of the method for simulated data the next step was to consider real data that Chris Knight has - that paper is under-way. If this interests you then Mhairi Kerr produced a masters thesis on the topic working with Vincent Macaulay. This has some further introductory content. Nick

Functions can evolve along evolutionary trees - just like genetic sequences. On the left-hand we provide a simulation of function evolution. On the right we use the data from the leaves of the evolutionary tree to reconstruct the common ancestral function. Red line is the value of the function we expect/predict and black line is an actual value (in grey is a measure of our uncertainty)

Cryptic Mitochondrial Mutations and Ageing

 Research into the underlying causes and consequences of ageing has long been of interest to scientists, and has resulted in a widely accept...