Wednesday, 12 November 2014

Mitochondrial motion in plants


Mitochondria are often likened to the power stations of the cell, producing energy that fuels life's processes. However, compared to traditional power stations, they're very dynamic: mitochondria move through the cell, and fuse together and break apart (among other things). Interestingly, their ability to move and undergo fusion and fission affects their functionality, and so has powerful implications for understanding disease and cellular energy supplies.


Because of this central role, it is important to understand the fundamental biological mechanisms that govern mitochondrial dynamics. Several important genes controlling mitochondrial dynamics are known in humans (and other organisms), but plant mitochondria (despite the fundamental importance of plant bioenergetics for our society) are less well understood.
Our collaborators, David Logan and his team, working with a plant called Arabidopsis, observed that a particular gene, entertainingly called "FRIENDLY", affected mitochondrial dynamics when it was artificially perturbed. (This approach, artificially interfering with a gene to explore the effects that it has on the cell and the overall organism, is a common one in cell biology.) We've just written a paper with them "FRIENDLY regulates mitochondrial distribution, fusion, and quality control in Arabidopsis" (free here) exploring these effects. Plants with disrupted FRIENDLY had unusual clusters of mitochondria in their cells, their mitochondria were stressed, and cell death and poor plant growth resulted.

Simulation of mitochondrial dynamics

We used a 3D computational and mathematical model of randomly-moving mitochondria within the cell to show that an increased "association time" (the friendly mitochondria stick around each other for longer) was sufficient to explain the experimental observations of clustered mitochondria. Our paper thus identifies an important genetic player in determining mitochondrial dynamics in plants; and explores in substantial detail the intra-cellular, bioenergetic, and physiological implications of perturbation to this important gene. Iain and Nick


Thursday, 23 October 2014

'Mitoflashes' indicate acidity changes rather than free radical bursts


As we've written about before, mitochondria generate the energy required by our cells through respiration that involves using an "electrochemical gradient" as an energy store (a bit like pumping water up into a reservoir for energy storage to then harness it flowing down the gradient of a hill to turn a turbine), and produces superoxide (free oxygen radicals) as a by-product (a bit like sparks when the pumps are running hot). The fundamental importance of this machinery which not only delivers energy, but is also involved in disease and aging  has led to its investigation in great molecular detail (comparable to taking the turbines and generators apart to learn about their function). Much less is known about how mitochondria actually behave when they are fully functional in their natural environment inside our cells (comparable to looking at the fully intact and running turbine), and progress has been difficult since suitable `tools' are scarce.

A debate exists in the scientific literature about one of the key "tools" used in the investigation of living cells. A particular fluorescent sensor protein called cpYFP (circularly permuted yellow fluorescent protein) is used in biological experiments, ostensibly as a way of measuring the levels of superoxide/free oxygen radicals  in a mitochondrion. Our colleagues, however, have cast doubt on the ability of cpYFP to measure superoxide, providing evidence that it instead responds to pH, part of the above electrochemical gradient. This debate was complicated by the fact that in biology, pH and superoxide can vary together, as the amount of "driving" and amount of "sparks" might be expected to.

As another analogy: If we found an unknown measuring device and we did not know how it works, but we saw that it responds during sunny weather, we may conclude that it measures warm temperature. However, it may in fact measure high atmospheric pressure which is, like warm temperatures, often correlated with good weather.  
The protein cpYFP changes its fluorescence in response to pH changes, but is unaffected by superoxide changes.

A recent and fascinating paper in Nature observed that "flashes" of the cpYFP sensor during early development of worms (as a model for other animals and humans) were correlated with their eventual lifespan. However, despite the debate about what it is exactly that the  cpYFP sensor measures, the paper interpreted it as responding to superoxide: looking at the correlation in the light of the so called “free radical theory of aging". This long-standing and much debated theory hypothesizes that the cause of why we age and eventually die is related to the constant production of free oxygen radicals in our mitochondria causing a steady increase in damage to our cells weakening their energetic machinery more and more and making them prone to illnesses.

In response to this, our colleagues decided to settle the question about what the sensor actually measures chemically, removing biological complications from the system. In the analogy of the unknown measurement device, the device was now tested under controlled temperature and controlled pressure to clearly distinguish between the two. They produced an experimental setup where a mix of chemicals was used to generate superoxide in the absence of any pH change. cpYFP in this mix did not show any signal, showing that it remains unresponsive to superoxide. In concert, they showed that even small changes in pH produced a dramatic response in cpYFP signal. Finally, they investigated the physical structure of cpYFP, showing that a large opening in the barrel-like structure of the protein exposes a pH-sensitive chemical group to its environment (comparable to showing how exactly the inner mechanics of the unknown measurement device can pick up pressure changes). We thus concluded, in a recent publication "The ‘mitoflash’ probe cpYFP does not respond to superoxide" (in the journal Nature here) that the cpYFP sensor reports pH rather than superoxide, and that results using cpYFP (including the above Nature paper, which remains fascinating) should be interpreted as such. Iain, Markus and Nick

Friday, 6 June 2014

Evolutionary competition within our cells: the maths of mitochondrial DNA

Women may carry mutated copies of mitochondrial DNA (mtDNA) -- a molecule that describes how to build important cellular machinery relating to cellular energy supply. If this mutant mtDNA is passed on to that woman's child, the child may develop a mitochondrial disease, which are often degenerative, fatal, and incurable.

Joerg created mice that contained two types of mtDNA -- here illustrated as blue (lab mouse mtDNA) and yellow (mtDNA from a mouse from a wild population). We used several different wild mice from across Europe to represent the mtDNA diversity one may find in a human population. We found that throughout a mouse's lifetime, one mtDNA type often outcompetes another (here, yellow beats blue), with different patterns across different tissues.
Amazing new therapies potentially allow a carrier mother A and a father B to use another woman C's egg cells to conceive a baby without much of mother A's mtDNA being present. The approach involves taking nuclear DNA content from A and B (so that most of the child's features are inherited from the true mother and father), and placing it into C's egg cells, which contain a background of healthy mtDNA. You can read about, what are misleadingly called, three-parent babies here.


Something that is less discussed is that, in this process, a small amount of A's mutant mtDNA can be "carried over" into C's cell. If this small amount remains small through the child's life, there is no danger of disease, as the larger amount of healthy C mtDNA will allow the child's cell to function normally. We can think of the resulting situation as a competition between A and C -- if A and C are evenly matched, the small amount of A will remain small; if C beats A, the small amount of A will disappear with time; and if A beats C, the small amount of A will increase and may eventually come to dominate over C.

Until recently it has been fair to assume that A and C are always about evenly matched (unless something is drastically different between A or C). However, evidence for this idea was based on model organisms in laboratories, which do not have the same amount of genetic diversity as found in human populations. Our collaborator Joerg addressed this by capturing wild mice from across central Europe, selecting a set that showed a comparable degree of genetic diversity to that expected in a human population. He used these, with our modelling and mathematical analysis, to show that pronounced differences between A and C often exist, and are more likely in more diverse populations. The possibility that A beats C, and mutant mtDNA comes to dominate the child's cells, therefore cannot be immediately discounted in a diverse population. We propose "haplotype matching" -- ensuring that A and C are as similar as possible -- to ameliorate this potential risk. It's open as to whether one can generalize from observations in mice to people and it's also open as to whether our conclusions, which used lab-mice as parent A (which are not entirely typical creatures) of necessity generalize to other non-lab mouse types. 

Our mathematical approach also allowed us to explore, in detail, the dynamics by which this competition within cells occurs. We were able to use our data rather effectively by having a statistical model that allowed us to reason jointly about a range of data sets. We found that the degree to which one population of mtDNA beat the other depended on how genetically different they were.  We found that different tissues were like different environments: some favouring C over A and some vice-versa. This is perhaps surprising to some as this evolution in the proportions of different genetic species is not something we imagine occurring inside us, during our lives, and as something that might differ between our organs. We found several different regimes, where the strength of competition changes with time and as the organism develops: when our cells are multiplying faster they show a more marked preference for one of the species. We've shown our results to the UK HFEA in its ongoing assessment of these therapies, and you can read, for free, about our work called ``mtDNA Segregation in Heteroplasmic Tissues Is Common In Vivo and Modulated by Haplotype Differences and Developmental Stage'' in the journal Cell Reports here. Iain, Joerg, Nick.


large Image
We found that one mtDNA type beat another in different ways across many different tissue type. Here, the height (or depth) of a column represents how much the mtDNA from a wild mouse wins (or loses) against that from a lab mouse in different tissues. The bottom row corresponds to the smallest difference between wild and lab mtDNA; the top row corresponds to the greatest difference.

Thursday, 10 April 2014

What's the difference? Telling apart two sets of signals

We are constantly observing ordered patterns all around us, from the shapes of different types of objects (think of different leaf shapes, yoga poses), to the structured patterns of sound waves entering our ears and the fluctuations of wind on our faces. Understanding the structure in observations like these have much practical utility: For example, how do we make sense of the ordered patterns of heart beat intervals for medical diagnosis, or the measurements of some industrial process for quality checking? We have recently published an article that automatically learns the discriminating structure in labeled datasets of ordered measurements (or time series or signals)---that is, what is it about production-line sensor measurements that predict a faulty process, or what is it about the shape of Eucalyptus leaves that distinguish them from other types of leaves?

Conventional methods for comparing time series (within the area of time-series data mining) involve comparing their measurements through time, often using sophisticated methods (with science fiction names like "dynamic time warping") that squeeze together pairs of time series patterns to find the best match. This approach can be extremely powerful, allowing new time series to be classified (e.g., in the case of a heart beat measurement, labelling it as a "healthy" heart beat or a "congestive heart failure"; or in the case of leaf shapes, labelling it as "Eucalyptus", "Oak", etc.), by matching them to a database of known time series and their classifications. While this approach can be good at telling you whether your leaf is a "Eucalyptus", it does not provide much insight into what it is about Eucalyptus leaves that is so distinctive. It also requires one to compare a new leaf to all other leaves in your database, which can be an intensive process. 


A) Comparing time series by alignment B) Comparing time series by their structural features: in this we probe many structural features of the time series simultaneously (ii) and then distil out the relevant ones (iii).
Our method learns the properties of a given class of time series (e.g., the distinguishing characteristics of Eucalyptus leaves) and classifies new time series according to these learned properties. It does so by comparing thousands of different time-series properties simultaneously, that we developed in previous work that we blogged about here. Although there is a one-time cost to learn the distinguishing properties, this investment provides interpretable insights into the properties of a given dataset (this kind of task is very useful for scientists when they want to understand the difference between their control data and the data from their experimental interventions) and can allow new time series to be classified rapidly. The result is a general framework for understanding the differences in structure between sets of time series. It can be used to understand differences between various types of leaves, heart beat intervals, industrial sensors, yoga poses, rainfall patterns, etc. and is a contribution to helping the data science/ big-data/ time-series data mining literature deal with...bigger data.
Each of the dots corresponds to a time series. The colours correspond to (computer generated) time series of six different types. We identify features that allow us to do a good job of distinguishing these six types.

Our work will be appearing with the name "Highly comparative, feature based, time-series classification" in the acronymically titled IEEE TKDE and you can find a free version of it here. Ben and Nick.

Wednesday, 9 April 2014

Polyominoes: mapping genotypes to phenotypes


Biological evolution sculpts the natural world and relies on the conversion of genetic information (stored as sequences, usually of DNA, called genotypes) into functional physical forms (called phenotypes). The complicated nature of this conversion, which is called a genotype-phenotype (or GP) map, makes the theoretical study of evolution very difficult. It is hard to say how a population of individuals may evolve without understanding the underlying GP map.

This is due to the two fundamental forces of evolution -- mutations and natural selection -- acting on different aspects of an organism. Mutations occur to genotypes (G), while natural selection, the ultimate adjudicator of the fate of mutations in the population, acts on the phenotype (P). Without understanding the link between these two -- the GP map -- we can't easily say, for example, how many mutations we expect important proteins within a virus strain to undergo with time, and thus how quickly the virus will evolve to be unrecognised by our immune systems.

Simple models for the mapping of genotype to phenotype have helped answer important questions for some model biological systems, such as RNA molecules and a coarse-grained model of protein folding. One important class of biological structure which has not yet been modelled in this way are protein complexes: structures formed through proteins binding together, fulfilling vital biological functions in living organisms. In this work, we introduce the "polyomino" model, based on the self-assembly of interacting square tiles to form polyomino structures. The square tiles that make up a polyomino are assigned different "sticky patches", modelling the interactions between different proteins that form a complex. A huge range of structures can be formed by varying the details of these patches, mimicking the range of protein complexes that exist in biology (though there are some obvious differences in the shapes of structures that can be formed).
Our simple model explores the interactions between protein subunits, and how these interactions shape a surface that evolution explores. (top) Sickle-cell anemia involves a mutation that changes the way proteins interact, making normally independent units form a dangerous extended structure. (bottom) Our polyomino model models this effect. The resultant dramatic effects on structure, fitness, and evolution can then be explored.
Despite its abstraction we show that the polyomino model displays several important features which make it a potentially useful model for the GP map underlying protein complex evolution. On top of this, we demonstrate that our model possesses similar properties to RNA and protein folding models, interestingly suggesting that universal features may be present in biological GP maps and that the "landscapes" upon which evolution searches may thus have general properties in common. You can find the paper free here and you can read about polominoes here and play a game here. Iain

Tuesday, 1 April 2014

Fast inference about noisy biology

Biology is a random and noisy world -- as we've written about several times before! (e.g. here and here) This often means that when we try to measure something in biology -- for example, the number of a particular type of proteins in a cell, or the size of a cell -- we'll get rather different results in each cell we look at, because random differences between cells mean that the exact numbers are different in each case. How can we find a "true" picture? This is rather like working out if a coin is biased by looking at lots of coin-flip results.

Measuring these random differences between cells can actually tell us more about the underlying mechanisms for things like (to use the examples above) the cellular population of proteins, or cellular growth. However, it's not always straightforward to see how to use these measurements to fill out the details in models of these mechanisms. A model of a biological process (or any other process in the world) may have several "parameters" -- important numbers which determine how the model behaves (the bias of a coin, is an example, telling us what proportion of times we'll see heads). These parameters may include, for example, rates with which proteins are produced and degraded. The task of using measurements to determine the values of these parameters in a model is generally called "parametric inference". In a new paper, I describe a new and efficient way of performing this parametric inference given measurements of the mean and variance of biological quantities. This allows us to find a suitable model for a system describing both the average behaviour and typical departures from this average: the amount of randomness in the system. The algorithm I propose is an example of approximate Bayesian computation (ABC) which allows us to deal with rather "messy" data: I also describe a fast (analytic) approach that can be used when the data is less messy (Normally distributed).


Parametric inference often consists of picking a trial set of parameters for a model and seeing if the model with those parameters does a good job of matching experimental data. If so, those parameters are recorded as a "good" set, otherwise, they're discarded as a "bad" set. The increase in efficiency in my proposed approach is due to the fact that we can perform a quick, preliminary check to see if a particular parameterisation is "bad", before spending more computer time on rigorously showing that it is "good". I show a couple of examples in which this preliminary checking (based on fast computation of mean results before using stochastic simulation to compute variances) speeds up the process by 20-50% on model biological problems -- hopefully allowing some scientists to grab a little more coffee time! This work will be coming out in the journal Statistical Applications in Genetics and Molecular Biology with the title `Efficient parametric inference for stochastic biological systems with measured variability' and you'll find the article (free) here. Iain

Tuesday, 1 October 2013

Inferring the evolutionary history of photosynthesis : C 4 yourself

Biological evolution is a complex, stochastic process which dictates fundamental properties of life. Our understanding of evolutionary history is severely limited by the sparsity of the fossil record: we only have a handful of fossilised snapshots to infer how evolution may have progressed throughout the history of life. Many physicists and mathematicians have attempted theoretical treatments of the process of evolution, using varying degrees of abstraction, in order to provide a more solid quantitative foundation with which to study this complex and important phenomenon, but the predictive power of these theoretical models, and their ability to answer specific biological questions, is often questioned.

Figure. (left) Examples of steps in an evolutionary space that involve individual changes from the absence of a C4 feature (0) to the presence of that feature (1). The bitstrings represent possible sets of plant features. (right) Steps from C3 to C4 embedded in the high-dimensional evolutionary space involved in our model. Coloured points mark sets of plant features that are compatible with one or more plants that currently exist: pathways involving these compatible sets are more likely to represent evolutionary history. 


We recently focussed on one remarkable product of evolution in plants: so-called "C4 photosynthesis". C4 consists of a complex set of changes to the genetic and physiological features which have evolved in some plants and act to increase the efficiency of photosynthesis. This complex set of changes has evolved over 60 times convergently: that is, plants from many different lineages independently "discover" C4 photosynthesis through evolution. We were interested in the evolutionary history of how these discoveries occurred -- both motivated by fundamental biology and the possibility of "learning from evolution" and using information about the evolution of C4 to design more efficient crop plants.

To this end, we modelled the evolution of C4 as a pathway through a space containing many different possible plant features. The pathway starts at C3 -- the precursor to C4 -- and progressively takes steps in different directions, acquiring one-by-one the features that sum up to C4 photosynthesis. Using a survey of plant properties from across the wide scientific literature, we identified which intermediate states these pathways were likely to pass through, given observed properties of plants that currently possess some, but not all, C4 features. We were then able to use a new inference technique to predict the ordering in which these likely pathways traverse the evolutionary space. We showed that this approach worked by both successfully inferring the known evolutionary steps in synthetic datasets and correctly predicting previously unknown properties of several plants, which we verified experimentally. Our (open access) paper is here and there's a less technical summary and commentary here. Our approach showed that C4 photosynthesis can evolve through a range of distinct evolutionary pathways, providing a potential explanation for its striking convergence. Several of these different pathways were made explicitly visible when we examined the inferred evolutionary histories of different plant lineages -- different families are likely to have converged on C4 through different evolutionary routes. Furthermore, the most likely initial steps towards C4 photosynthesis are surprisingly not directly related to photosynthesis, being solutions to different biological challenges, but also providing evolutionary "foundations" upon which the machinery of C4 can evolve further. We hope that the recipes for C4 photosynthesis that we have inferred find use in efficient crop design, and anticipate our inference procedure being of use in the study of other specific biological questions regarding evolutionary histories. Iain

Wednesday, 3 April 2013

A compound methodological eye on nature’s signals


A compound methodological eye on nature’s signals: Background signals are both empirical (e.g. ECGs and human speech) and simulated (e.g. correlated noise and maps); the arctic krill eye shows output from thousands of time-series analysis methods wrapped around it [Fig.1 of our paper showing the results of applying 8651 methods to a set of time series]. Image created by B. D. Fulcher Accreditation details for the krill eye can be found here.
"… as an uneven mirror distorts the rays of objects according to its own figure and section, to the mind, when it receives impression of objects through the sense, cannot be trusted to report them truly, but in forming its notions mixes up its own nature with the nature of things…" Francis Bacon

We are constantly interacting with signals in the world around us: noticing the fluctuating breeze against our faces, observing the intermittent flickering of a candle, or becoming absorbed in the regularity of one’s own pulse. Researchers across science have developed highly sophisticated methods for understanding the structure in these types of time-varying processes, and identifying the types of mechanisms that produce them. However, scientists collaborate between disciplines surprisingly rarely, and therefore tend to use a small number of familiar methods from their own discipline. But how do the standard methods used in economics relate to those used in biomedicine or statistical physics?

In a recent article "Highly comparative time-series analysis: the empirical structure of time series and their methods" that appeared, accessible free, in Journal of the Royal Society Interface, we investigated what can be learned by comparing such methods from across science simultaneously. We collected over 9000 scientific methods for analysing signals, and compared their behaviour on a collection of over 35 000 diverse real-world and model-generated time series. The result provides a more unified and highly comparative scientific perspective on how scientists measure and understand structure in their data. For example, we showed how methods from across science that display similar behaviour to a given target can be retrieved automatically, or how different real-world or model-generated data with similar properties to a target time series can be retrieved similarly. Further examples of the kinds of questions we ask are in the boxes in the figure below. The result provides an interdisciplinary scientific context for both data and their methods. We also introduced a range of techniques for exploiting our library of methods to treat specific challenges in classification and medical diagnosis. For example, we showed how useful methods for diagnosing pathological heart beat series or Parkinsonian speech segments can be selected automatically, often yielding unexpected methods developed in disparate disciplines or in the distant past.

Representing a time series by the results of the behaviour of a set of automatically selected statistical methods and, unusually, representing statistical methods by their behaviour on a set of time series provides a form of empirical fingerprint for our time series and our methods. Given this fingerprint we can automatically answer questions like those posed in the boxes above. This gives us a powerful complement to the more conventional process of studying our methods and our data. [Based on Fig 2 of our paper]

We are developing a web platform to help this kind of comparative interdisciplinary scientific analysis, which can be found at http://www.comp-engine.org/timeseries/ The plan is to use this to allow people to exchange data, code for methods and to put each object in its context. Ben, Max and Nick

Tuesday, 5 February 2013

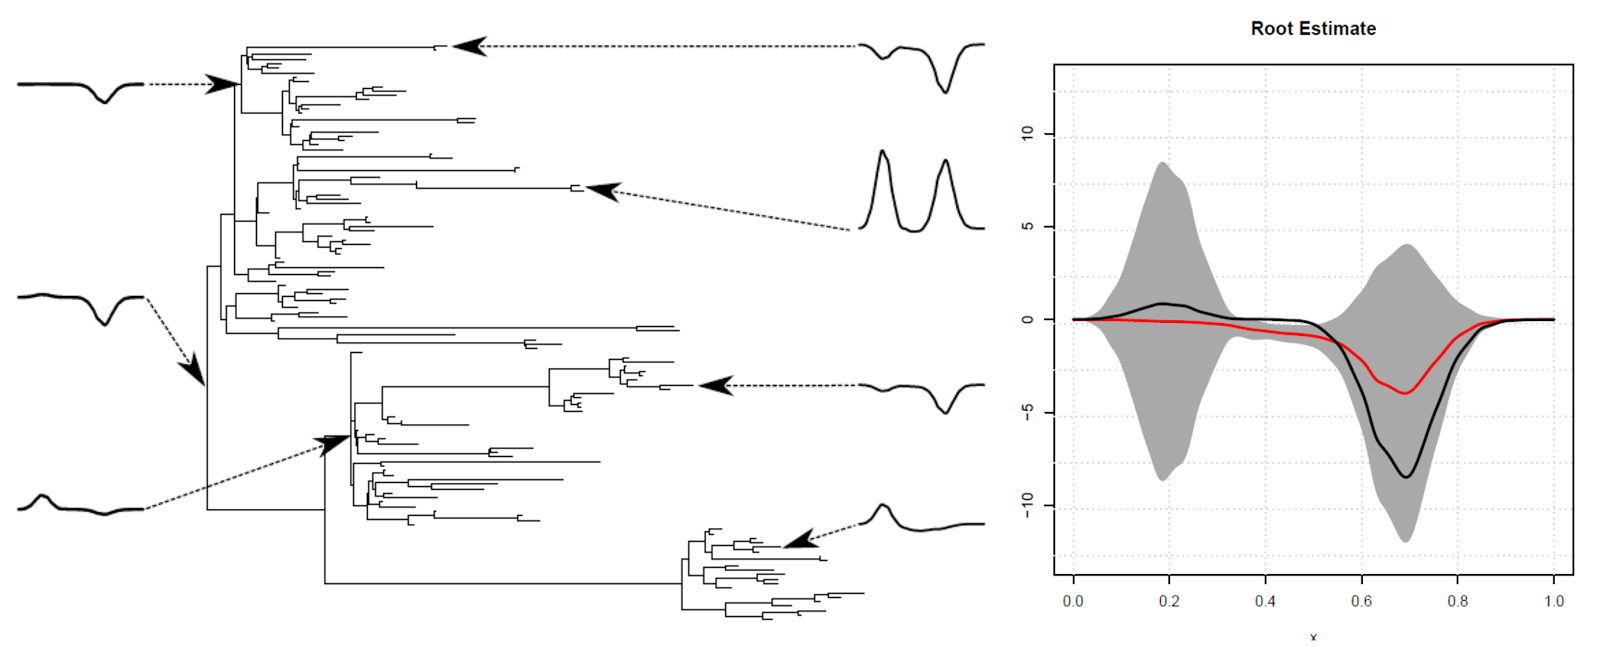
Evolutionary inference for functions

How might we reason about the forms of our unseen ancestors? I discuss a possible application to speech sounds in an earlier blog article (necrophonetics). A paper with John Moriarty which provides relevant theory came out lately in Royal Society Interface as "Evolutionary inference for function-valued traits: Gaussian process regression on phylogenies" (free version from this page). The gist of the idea is that some things in nature, like sounds or patterns, evolve in time and are best described as mathematical functions. Gaussian processes are a class of process which are very suited to the evolution of functions. An example of an evolving function would be a drawing of a line which is copied repeatedly (see here for a movie of us making school students do this). Having done the theory, Pantelis Hadjipantelis from Warwick (a student of John Aston) and  Chris Knight and David Springate helped take this further. They investigated whether our theory could be made to work in practice and considered careful simulated examples. In these we could see how our best estimate about characteristics of the evolutionary process and the form of the ancestors compared against (simulated) reality. We did reasonably well. On the way we used Independent Components Analysis - a very handy method. This work will be appearing shortly in Royal Society Interface as "Function-Valued Traits in Evolution" free version here. Having convinced ourselves of the relevance of the method for simulated data the next step was to consider real data that Chris Knight has - that paper is under-way. If this interests you then Mhairi Kerr produced a masters thesis on the topic working with Vincent Macaulay. This has some further introductory content. Nick

Functions can evolve along evolutionary trees - just like genetic sequences. On the left-hand we provide a simulation of function evolution. On the right we use the data from the leaves of the evolutionary tree to reconstruct the common ancestral function. Red line is the value of the function we expect/predict and black line is an actual value (in grey is a measure of our uncertainty)

Tuesday, 29 January 2013

Statistics vs Physics

While there's a whole branch of physics called statistical physics (probably a misleading title) physicists often get only a few hours of statistical training in their undergraduate degrees. This is surprising to some who think of physicists as the most mathematical of scientists. In fact you can find a diversity of statistical crimes/accidents in physics papers (and I'm sure you can find them in my own). In partial acknowledgement of this, I organised this Royal Society Discussion Meeting and edited this volume of the Philosophical Transactions of the Royal Society “Signal Processing and Inference for the Physical Sciences” with the excellent Prof Tom Maccarone (now at Texas Tech Astrophysics and Astronomy). Our goal was to expose physical scientists to some new topics in statistical inference and some data analysts to physical challenges. Lots of the volume is free and there are also talks from the authors and slides on this page. We provide an introduction "Inference for the Physical Sciences" which we hope can serve as a jumping off point for physical scientists wanting to use statistical tools. Max Little also wrote an article highlighting some challenges in signal processing in biophysics "Signal processing for molecular and cellular biological physics" putting some of our other work in context (see previous blog articles on finding steps beneath the noise and on molecular dance steps). For those with an interest in Machine Learning I think the talks by Bishop, Gharamani, Roberts and Hyvärinen are worth a look. Nick

Dr Ben Fulcher made the image above - similar signals are linked up (see a pending blog article) and we have to guess whether the green event that mysteriously occurred in Russia was a blue test explosion or a red earthquake...

Wednesday, 3 October 2012

Exploring noise in cellular biology


We're used to thinking about machines as robust, hard-wearing objects made from solid materials like metal and plastics. If they crack, split or overheat they are liable to malfunction, and if we subject them to too much jostling and shaking we're asking for trouble. However, the biochemical machines responsible for keeping us alive work in a rather different world -- they're made from soft, organic materials, and contained in a disorganised bag (the cell) that is constantly shaken, bumping our machines against each other and other cellular inhabitants. How can the delicate processes required by living organisms take place in this chaotic environment? And how can scientific progress be made in such a tumultuous, unpredictable world?

Extrinsic factors can modulate the stability of essential, but noisy, cellular circuits


Iain recently wrote an article, targeted at a broad audience, looking at some of these questions. One of the most important cellular processes that has to take place in this chaotic world is that of 'gene expression': the interpretation of genetic blueprints which describe how to build cellular machinery, and the subsequent construction process. Gene expression can be likened to using a bad photocopier to copy books from a library that opens and closes randomly, then using these photocopies (which are prone to decay) to construct machines. This problematic environment gives rise to many medically important random effects, including bacterial resistance to antibiotics and differing responses to anti-cancer drugs. We are particularly interested in how fluctuating power supplies (see our other blog articles here, here and here!) influence the cell's ability to produce these machines, and what effects this unreliable power has on medically important processes. The article -- available here and appearing in the expository magazine Significance -- takes a look at how cellular noise arises, current techniques for its detection and analysis, and its influence on important biological phenomena. Iain

Cryptic Mitochondrial Mutations and Ageing

 Research into the underlying causes and consequences of ageing has long been of interest to scientists, and has resulted in a widely accept...